
Antarctica’s Doomsday Glacier: Why a 2026 Study Projects More Sea-Level Rise
A new 2026 study projects up to about 3 cm from Thwaites Glacier by 2100 in some simulations. Here is the overlooked grounding-zone physics—and what the results do and do not mean.
Contents
- What changed in the new Thwaites Glacier study?
- Where is Thwaites Glacier, and why is it called the “Doomsday Glacier”?
- Grounding line versus grounding zone: the key to understanding the findings
- A grounding line is a simplified boundary
- The grounding zone can extend for kilometers
- What the scientists measured, and what they simulated
- The 2100 numbers: what 8 mm, 19 mm and 30 mm actually represent
- Could Thwaites detach from its stabilizing ridge as early as 2038?
- Why the study used no additional ocean warming—and why that matters
- A second 2026 study reached a related, but different, conclusion
- What this could mean for coastal cities—and what it cannot tell us
- What the 2026 model still cannot resolve
- How to read the next Thwaites headline without being misled
- What the result means in one paragraph
- Original research, official sources and real-image references
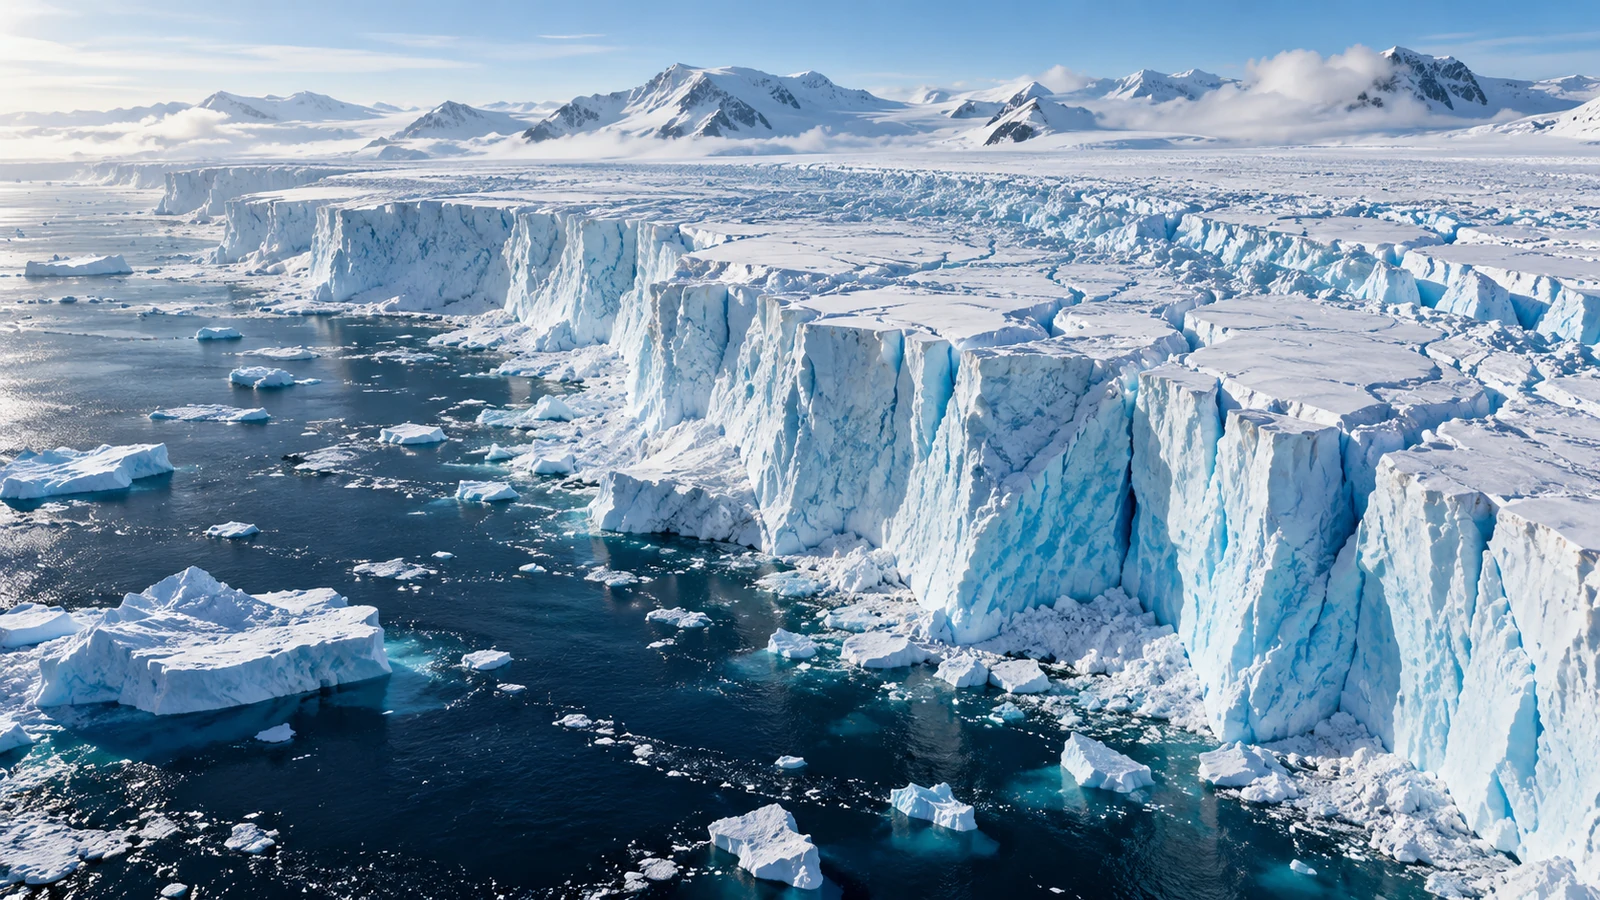
Thwaites Glacier could add roughly 30 millimeters (3 centimeters) to global mean sea level by 2100 in one of the higher-loss scenarios in a peer-reviewed study published on October 12, 2026. That is about twice the mean of a particular earlier model comparison under matching constant-climate assumptions—not proof that the glacier will collapse this century or that all global sea-level predictions have doubled. The result matters because the study identifies a physical process many ice-sheet models simplify: warm seawater entering kilometers beneath grounded ice. Read the original Nature Communications paper.
NASA summarized the research on October 20, 2026. Its headline finding was that a more realistic treatment of the ice–ocean boundary helped a model reproduce the glacier’s recorded retreat and generated larger future contributions in some runs. This guide goes beyond the headline to unpack the model, explain the uncertainties, and show exactly what the numbers mean for readers near a coast. NASA’s announcement is useful context, but the study itself is the source for the scenario values.
What changed in the new Thwaites Glacier study?
The researchers—Mattia Poinelli and colleagues from NASA’s Jet Propulsion Laboratory, the University of California, Irvine, Dartmouth College and collaborating institutions—tested a physically important idea. Where ice changes from resting on the seabed to floating in the ocean, the transition is not always one fixed line. Tides can push relatively warm seawater beneath stretches of ice still otherwise grounded on the bed. This moving, several-kilometer-wide contact region is called the grounding zone.
The study used the Ice-sheet and Sea-level System Model (ISSM), and compared simulations with independent historical records of ice speed, thickness change and grounding-position retreat from 1996 through 2023. Models allowing actively melting grounding zones about 2–5 km wide reproduced the observed evolution better than simulations relying on a conventional sharp grounding boundary. The calibrated models were then run forward to 2100 using a controlled ocean-temperature baseline rather than assuming ever-increasing ocean warming. Methods and results.
The practical takeaway is subtle: better physics near the bed can change an ice-loss projection even when a model does not add more climate warming. The comparison is about what the glacier does at its base, not an announcement that 3 centimeters of global rise has already happened.
Where is Thwaites Glacier, and why is it called the “Doomsday Glacier”?
Thwaites is a huge outlet glacier draining part of the West Antarctic Ice Sheet into the Amundsen Sea. It is closely watched because its inland bed geometry can make retreat self-reinforcing in some circumstances: a grounding boundary moving into deeper terrain may expose thicker ice to the ocean and increase discharge. The media label “Doomsday Glacier” draws attention to those stakes, but it is not a scientific forecast that disaster will occur on a specific date.
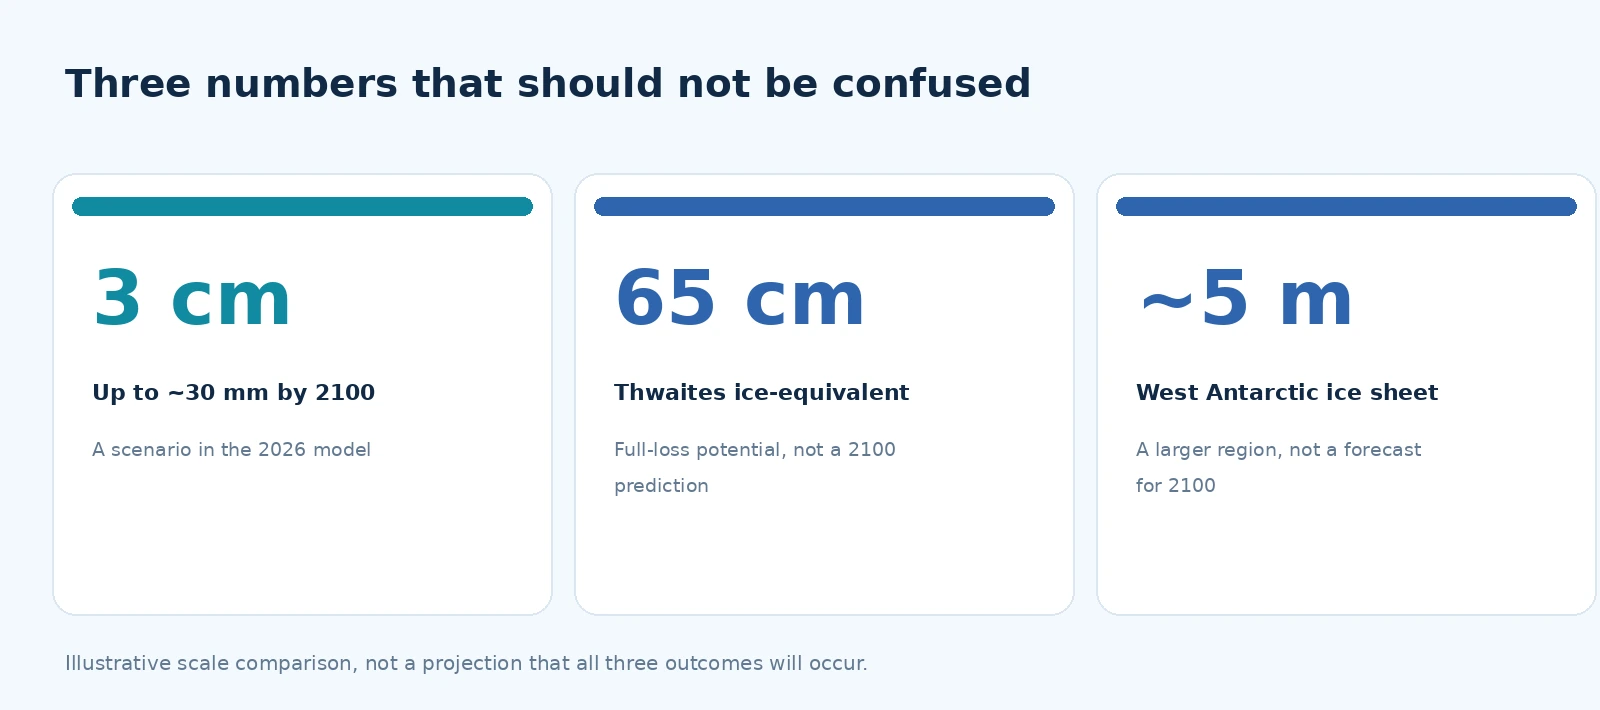
The paper describes the glacier as holding roughly 65 centimeters of global mean sea-level equivalent if all the relevant ice ultimately entered the ocean. That is a possible full-loss equivalent, not the amount researchers forecast by 2100. For comparison, the much larger West Antarctic Ice Sheet contains enough ice to raise the sea globally by around five meters if lost, a separate geographic scale discussed by the British Antarctic Survey. A few centimeters this century, 65 centimeters from complete Thwaites loss, and several meters from a much larger region are three entirely different statements. Source for the Thwaites ice equivalent; BAS context for West Antarctica.
In photographs, the most visible change is at the ice shelf and calving front. Yet the mechanism driving this new paper is partly hidden below the surface. A visible iceberg breaking away is not, by itself, evidence that the grounding zone has unpinned from a stabilizing ridge. Satellite radar and observations of ice elevation and speed are needed to test that much deeper process.
Grounding line versus grounding zone: the key to understanding the findings
A grounding line is a simplified boundary
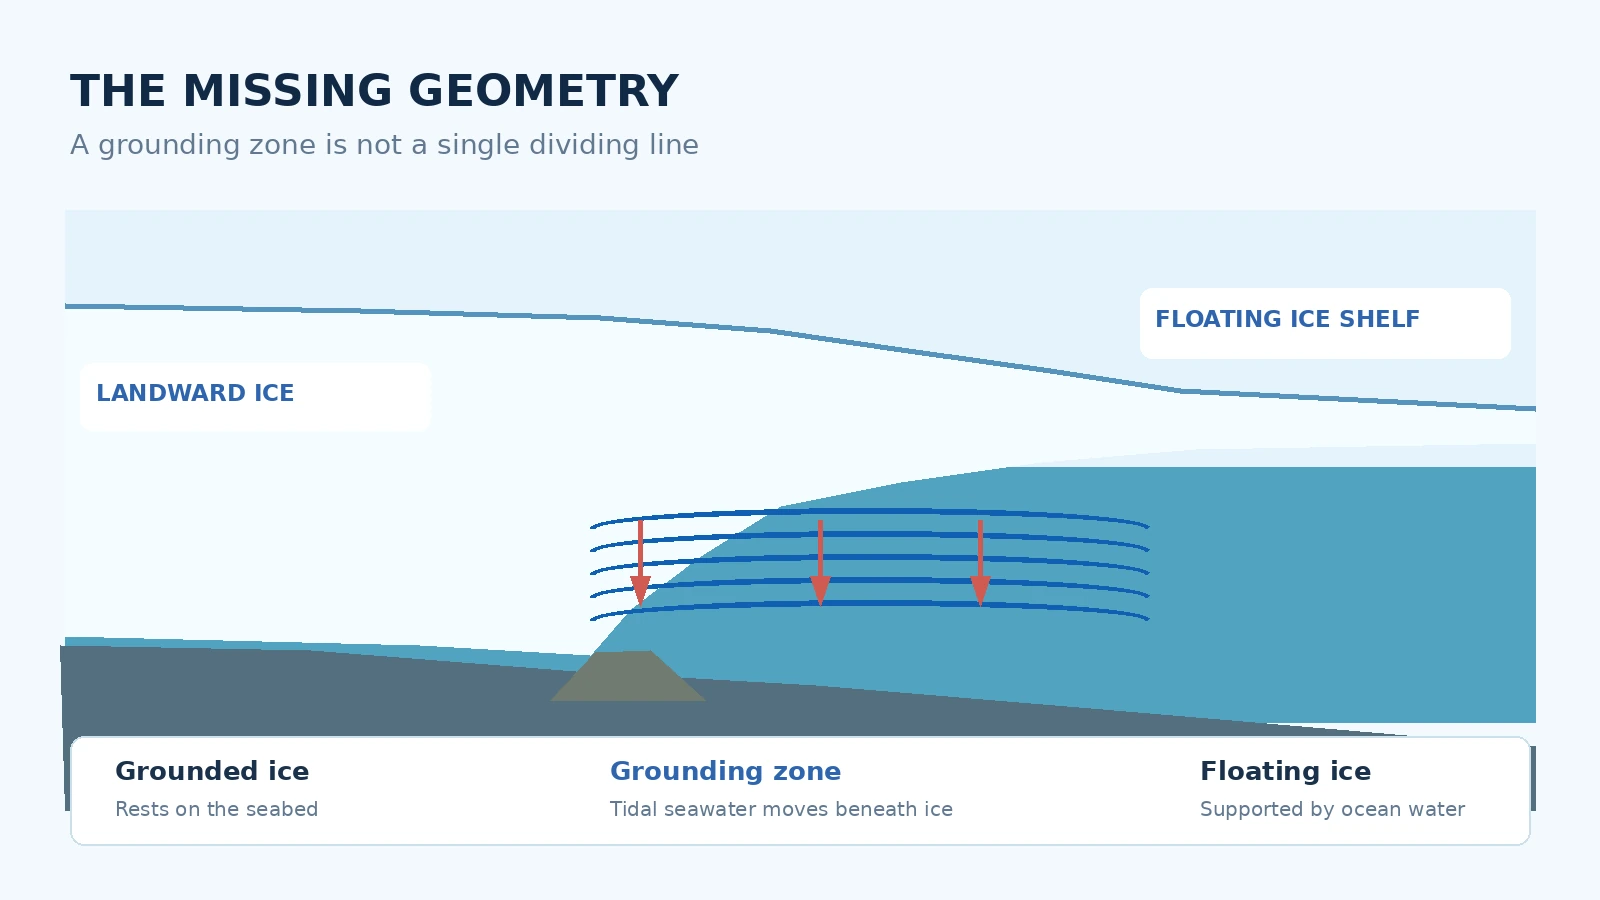
For a grounded glacier, ice rests on rock or seabed. Offshore, sufficiently buoyant ice can float as a shelf. Models often represent the change between those states with a narrow line, the grounding line. This is mathematically useful: a model can calculate how the position changes as ice thins or the bed becomes more or less supportive.
The grounding zone can extend for kilometers
At Thwaites, high-resolution radar observations show that seawater can intrude repeatedly beneath ice that is not permanently afloat. Tides can flex or lift parts of that zone and allow warmer, saltier water to circulate under the ice. These episodes can enhance basal melting and alter the forces keeping the glacier in place. The research used the term actively-melting grounding zone for this wider, dynamic transition. The graphic above is an original explanatory cross-section, not a measurement from beneath the glacier.
The paper reports effective grounding zones that successfully reconstructed recent historical behavior over scales of roughly 2 to 5 km. It also tested different lengths between 1 and 6 km, and satellite observations show that short-lived intrusions can sometimes extend farther. These are different measures: an effective length in a model is not the exact distance seawater reaches at every tide on every day. The authors discuss the time-averaged assumption.
What the scientists measured, and what they simulated
A useful way to avoid exaggerating the news is to separate past observations from future scenarios. Scientists have measured retreat, thinning and changes in flow over recent decades. Researchers also have satellite evidence consistent with periodic seawater incursions at the grounding zone. Those facts constrain a model; they do not directly measure how much global sea level will rise in 2100.
- Observed inputs: satellite-based grounding positions, surface velocities and ice-thickness changes for the historical period.
- Model reconstruction: simulated the past with and without a broad, melting grounding zone and checked the fit against multiple observations.
- Future simulations: carried the calibrated physics forward under stated assumptions about future ocean forcing.
- Reported outputs: changes in retreat timing, the likelihood of crossing a stabilizing ridge within the model ensemble, and global mean sea-level equivalents by 2100.
One important technical check was whether a model reproduced several types of past behavior at once. A single ice-speed fit might still miss thinning or grounding retreat. The 2026 paper compared all three, allowing the authors to narrow a useful region of parameter space. NASA described the resulting match to historical satellite data as roughly four times closer than in models lacking the zone; treat that as a model-performance comparison, not a statement that all forecast uncertainty has become four times smaller. NASA explanation.
The 2100 numbers: what 8 mm, 19 mm and 30 mm actually represent
With a representative submarine melt rate used in the paper, the sea-level contribution changes substantially as the assumed grounding-zone length changes. Each colored bar in the chart below is a scenario-specific estimate for Thwaites alone, not total global sea-level rise from all causes. The uncertainty values plotted are the study’s reported values for these selected configurations; they do not span every possible future climate or structural uncertainty.
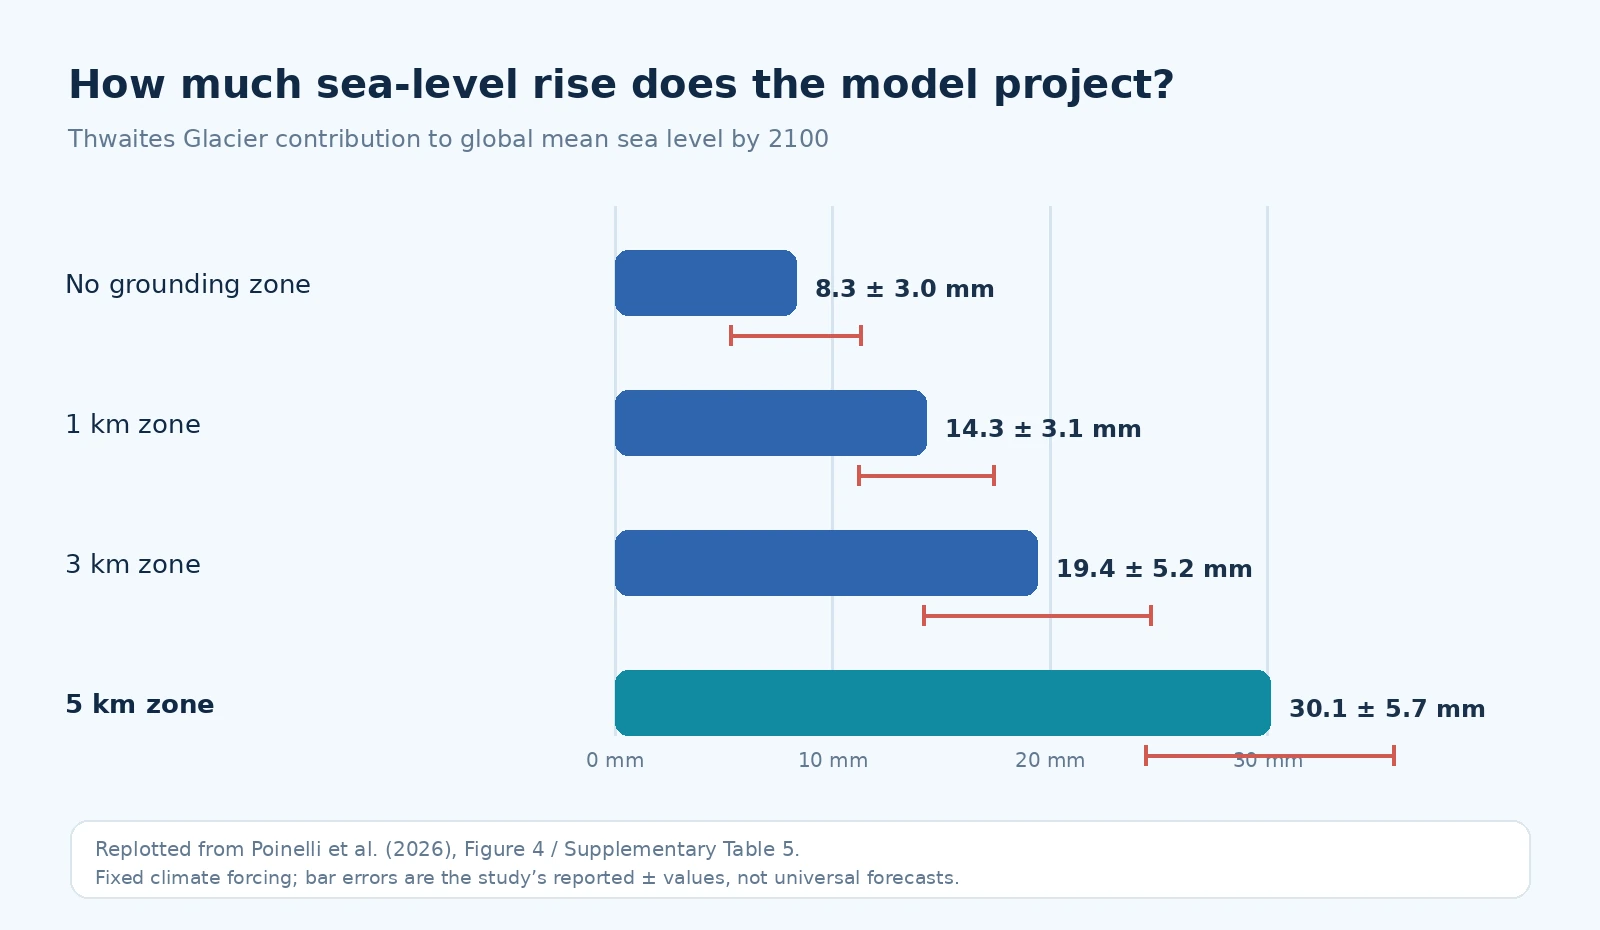
The research reports approximately 8.3 ± 3.0 mm with no modeled grounding zone; 14.3 ± 3.1 mm for a narrow 1 km setting; 19.4 ± 5.2 mm with a 3 km setting; and 30.1 ± 5.7 mm when the grounding zone is 5 km. These values use the specified representative melt rate and the study’s constant-climate forcing setup. The upper scenario roughly doubles the mean from a referenced ISMIP6 model ensemble of 15.2 mm under the comparison framework. It does not mean the worldwide sea-level rise already recorded by satellites has doubled. Study projections, Figure 4 and Supplementary Table 5.
Put another way, 30 millimeters is about 1.2 inches, compared with roughly 0.6 inch for 15 millimeters. Those numbers may look small compared with the glacier’s enormous size, but global average sea level combines ice losses from many sources, thermal expansion of seawater and other factors. Additional centimeters can increase the baseline on which storm surges and high tides act; the impact at a specific coastline depends on local geography and relative sea-level changes.
Could Thwaites detach from its stabilizing ridge as early as 2038?
The model identifies a seabed high called Mouginot Ridge as a stabilizing feature for Thwaites’ fast-moving western sector. That ridge can temporarily resist retreat. The authors simulated a loss of contact, or unpinning, in some configurations with extensive grounding zones. When the ice loses that restraint, retreat can continue inland toward another topographic high called South Ridge.
Under grounding-zone lengths of roughly 4–6 km, the ensemble reported around 60% probability of crossing the ridge by 2100. Some high-intrusion configurations produced modeled unpinning as early as 2038. Crucially, that early year is an edge of the simulation outcomes, not a dated prediction that Thwaites will lose its support in 2038. For 2–3 km settings, the modeled probability was closer to 45% by 2100. The paper’s Fig. 5 explains the distributions.
Probabilities from one family of model simulations are conditional on its physics, parameter choices, historical calibration and forcing assumptions. A “60% chance” in the study must not be read as an objectively measured worldwide probability of complete glacier collapse, or as a 60% chance of coastal flooding for any one city.
Why the study used no additional ocean warming—and why that matters
One of the most frequently misunderstood details is the study’s forcing experiment. The researchers held the climate/ocean thermal forcing approximately fixed at a historical baseline to isolate the effect of grounding-zone geometry and melting. That does not mean the ocean had no warmth, that the glacier ceased melting, or that the authors proved future climate change will stop. Warm ocean water continued to drive basal melting inside the simulated grounding zones.
This controlled design asks a narrow but valuable question: How much retreat can arise from the missing grounding-zone physics even before further warming is added? If more warming occurs, the response could differ. The authors also tested a moderate increase in thermal forcing and discussed other unmodeled physical feedbacks. The main result is therefore a warning about underrepresented physical processes, not a claim to have calculated every future trajectory.
A second 2026 study reached a related, but different, conclusion
In separate work publicized by the British Antarctic Survey in October 2026, researchers examined an extreme hypothetical case in which ocean-induced ice-shelf melting was switched off in three ice-sheet models. Even under that artificial cooling experiment, Thwaites kept losing ice over the 150-year model horizon, although losses slowed. Its neighbor Pine Island Glacier responded differently. The underlying peer-reviewed paper appeared in Geophysical Research Letters.
These two 2026 findings should not be merged into one statistic. The Nature Communications study estimates Thwaites loss when a melting grounding zone is explicitly represented under steady forcing. The BAS-highlighted study instead probes how the glaciers respond if ocean-driven melting were removed. Together they help explain why ice-sheet change can have momentum, but they do not prove that every proposed intervention is useless or that the speed of future sea-level rise is fixed.
What this could mean for coastal cities—and what it cannot tell us
The scientifically meaningful measure here is a contribution to global mean sea level. A person living near Miami, New York, London, Alexandria or a low-lying island does not experience a perfectly uniform copy of the global average. Ocean circulation, land motion, gravitational effects as ice mass moves, storm conditions and local coastal protections also shape observed relative sea level and flooding risk.
A worked interpretation: suppose a separate climate assessment for a region gave a future global-average sea-level range from multiple causes. The Thwaites scenario from this paper is one component of that larger picture. You would not simply add 30 mm on top of a published projection that already includes Antarctic ice loss, because doing so could count the same process twice. Instead, scientists would update the Antarctic component within a consistent set of scenarios and rerun coastal impact estimates.
Likewise, it would be misleading to turn the study’s 30 mm into a precise prediction of which roads or buildings will flood. For local planning, look for national tide-gauge agencies, flood maps and regional sea-level assessments. The IPCC’s sea-level chapter explains why regional projections combine multiple processes and uncertainty sources.
What the 2026 model still cannot resolve
The authors are clear that a better historical fit does not remove structural uncertainty. Among the remaining challenges are the bathymetry under floating ice, the way water circulates within evolving ice cavities, future ocean-temperature changes, and how the distance seawater intrudes changes with tidal cycles and glacier geometry.
- Fixed effective zone width: the model assigns an effective grounding-zone length; the real boundary varies over time and space.
- Seabed uncertainty: poorly surveyed depths beneath ice can change when and where it detaches from a ridge.
- Ocean coupling: the study does not dynamically resolve all feedbacks between changing ice-cavity shape and seawater circulation.
- Future forcing: steady thermal conditions isolate one process but are not a complete prediction of future ocean or atmosphere.
- Model diversity: a calibrated model family can outperform some alternatives historically without eliminating differences among independent models.
These limitations are reasons to improve measurements, not reasons to ignore the observations. The paper calls for sustained, direct measurements of temperature, salinity and water circulation beneath the ice shelf. Such fieldwork is difficult and expensive, but it can test mechanisms that satellites cannot measure on their own. See the discussion and study limitations.
How to read the next Thwaites headline without being misled
- Check the timeframe. Does a claim refer to ice already lost, projected loss by 2100 or a much longer complete-melt potential?
- Identify the geography. Is the number for Thwaites alone, West Antarctica or the whole global ocean?
- Identify the unit. Millimeters of global average sea level are not meters of local storm surge.
- Look for scenario conditions. Were temperatures held fixed, increased, or set to an extreme hypothetical state?
- Separate events from probabilities. “As early as 2038” is not the same as “will happen in 2038.”
- Ask what is observed. Satellite retreat records support a model but cannot directly observe the year-2100 outcome.
For a real view of the ice, NASA’s Landsat comparison of Thwaites from 2001 and 2019 is particularly useful: it shows changes at the ice tongue, not a fabricated picture of the underwater grounding zone. A documented NASA image of Thwaites on Wikimedia Commons provides another genuine photographic reference. Readers should distinguish those photographs from the explanatory model diagrams in this article.
What the result means in one paragraph
The October 2026 study makes a plausible, observation-checked case that models omitting a wide, actively melting grounding zone can underestimate Thwaites Glacier’s contribution to sea-level rise. With that process included, some simulations yield approximately 3 centimeters of global mean rise from Thwaites by 2100, compared with roughly 1.5 centimeters from a selected earlier-model mean under comparable assumptions. This does not forecast an imminent “doomsday,” but it strengthens the case for studying the hidden glacier–ocean interface and planning around a broad range of credible coastal outcomes.
More climate and science coverage on Horus Valley: Ancient Objects Emerging From Melting Glaciers explores a different consequence of shrinking ice; What NASA Satellites Reveal About the 2026 El Niño explains how to read another kind of satellite-driven climate evidence. Neither should be confused with the Thwaites study.
Original research, official sources and real-image references
- Poinelli et al., Nature Communications (October 12, 2026) — peer-reviewed original research, scenario values, methods and limitations; DOI: 10.1038/s41467-026-77976-1.
- NASA Science (October 20, 2026) and NASA JPL — official explanation of the study and 2014 documentary photograph credit.
- British Antarctic Survey (October 13, 2026) and the separate peer-reviewed zero-melt experiment — context on the glacier’s continuing losses.
- NASA Earth Observatory: Thwaites Glacier Transformed — genuine Landsat imagery from 2001 and 2019, credited to NASA Earth Observatory/Lauren Dauphin using USGS Landsat data.
- Thwaites Glacier photo on Wikimedia Commons — NASA-origin image with public-domain provenance; use according to NASA media guidelines.
You may also like
 Science & Discoveries
Climate Prediction Center Heavy Snow Map: November Outlook
Read NOAA’s November heavy-snow outlook, see the mountain areas at risk, understand the map’s limits, and find local…
 Science & Discoveries
UK November Cold Snap: What the Met Office Forecast Says
What the Met Office forecast says about the UK November cold snap, possible northern wintry showers, frost and…
 Science & Discoveries
Altermagnetism Explained: What the New Evidence Shows
What is altermagnetism? Understand the new MnTe experiment, how it differs from other magnetic orders, and what the…