
2026 El Niño Explained: What NASA Satellites Reveal About Winter 2026–27
NASA satellites reveal a powerful 2026 El Niño. Decode the ocean maps, NOAA winter 2026–27 forecast, UK and Australian signals, and what the probabilities really mean.
Contents
- The quick answer: what is happening with El Niño in October 2026?
- How El Niño works: the ocean-to-atmosphere chain reaction
- What NASA’s satellites actually reveal
- 1. Sentinel-6: an unusually high sea surface can signal redistributed warm water
- 2. Sea-surface temperature: a warm anomaly is a difference from normal
- 3. PACE ocean color: the blue shift reveals an ecological response
- What NOAA forecasts for U.S. winter 2026–27
- Why a warmer winter can still bring snow
- What about flooding, drought and wildfire risk?
- What does El Niño mean for the UK and Ireland?
- Australia’s spring and summer: why “strong El Niño means drought everywhere” is wrong
- How to read an official seasonal outlook: five-minute guide
- Worked example: what “50% chance of above-normal rainfall” really means
- A practical source-checking workflow: what to bookmark and when
- Case study: three different decisions from the same El Niño
- How the satellites and forecast models fit together—and where uncertainty remains
- Seven misleading claims about El Niño—and how to check them
- Claim 1: “A satellite photo proves the biggest winter storm is coming”
- Claim 2: “Super El Niño guarantees a terrible winter”
- Claim 3: “A warmer winter means there will be no freezing weather”
- Claim 4: “El Niño caused every flood or wildfire this year”
- Claim 5: “Australia will be dry in every state”
- Claim 6: “NASA’s blue sea means it is safer or colder everywhere”
- Claim 7: “83% chance of strong El Niño means 83% chance of floods”
- What households and travellers can do now without overreacting
- The bottom line: strong signal, different local outcomes
- Original agency sources and data to explore
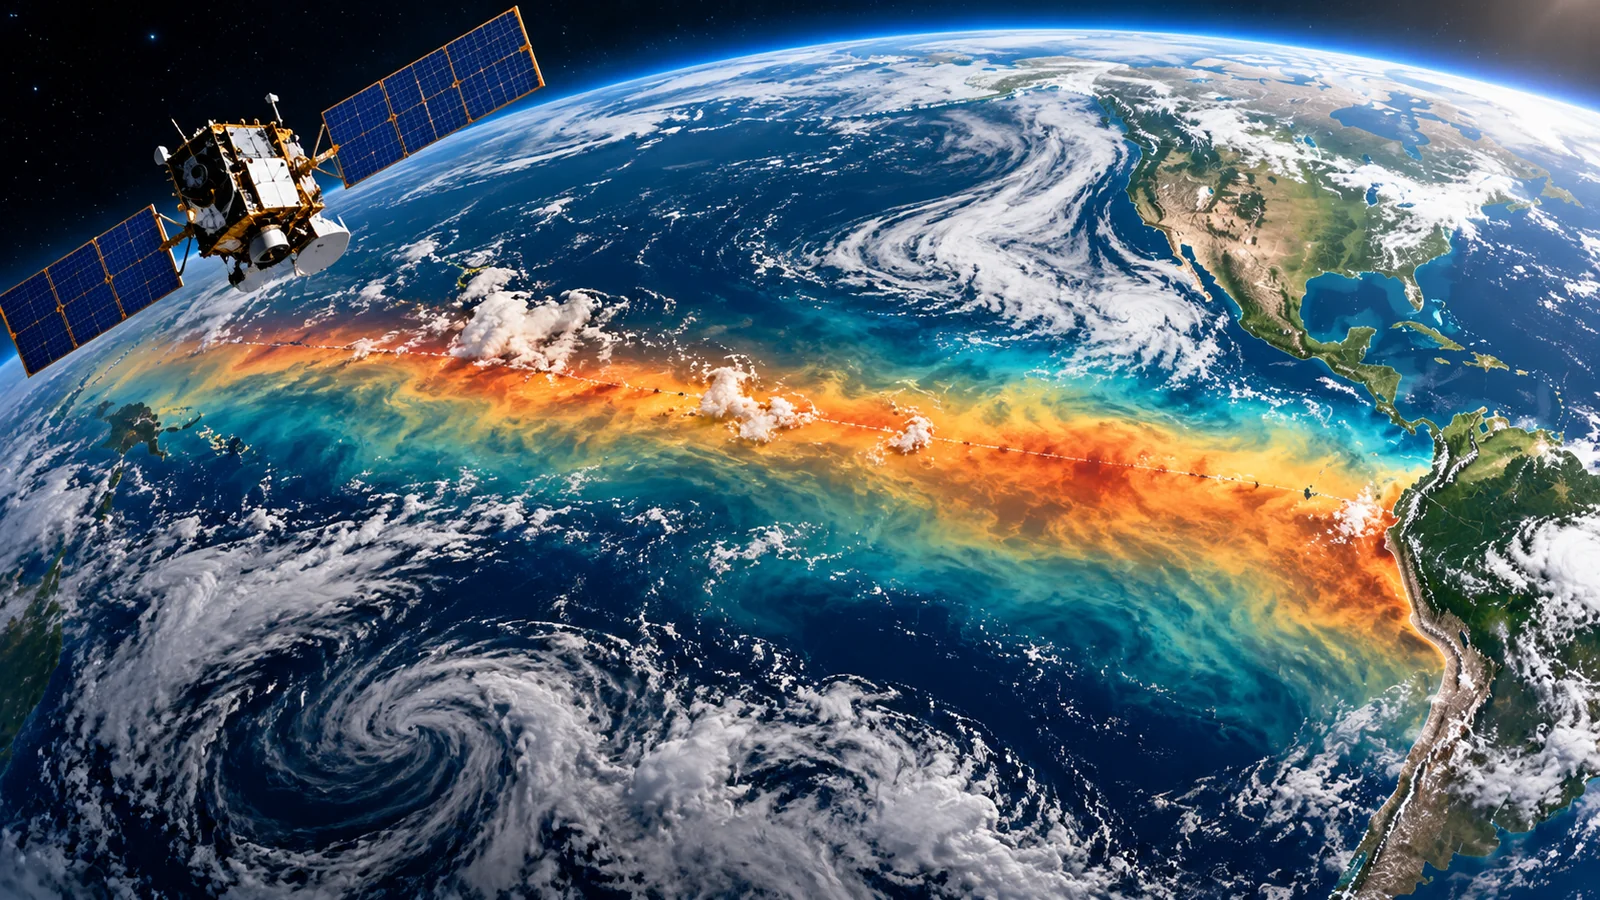
El Niño is already influencing the 2026–27 outlook—but a satellite map cannot tell you whether it will snow on your street. On October 15, 2026, NASA published a striking new comparison of the tropical Pacific in 2025 and 2026. Its satellites track three different changes: the height of the sea surface, the temperature of surface water and subtle shifts in ocean color. Taken together, those measurements show how this unusual El Niño is developing. On the same date, NOAA released its U.S. winter outlook, favoring warmer conditions in much of the northern country and wetter conditions across broad parts of the southern United States and East Coast.
This guide connects those two stories. You will learn what the satellite evidence actually measures, what NOAA’s percentages mean, how winter 2026–27 may differ across the US, UK and Australia, and how to check reliable local updates. It also separates well-established climate signals from headlines that promise a particular snowstorm months before it exists. This article is a snapshot updated October 19, 2026; conditions and seasonal probabilities will change as agencies publish new outlooks.
The primary evidence comes from NASA’s October 15 satellite analysis, NOAA’s October 8 ENSO Diagnostic Discussion and NOAA’s October 15 U.S. Winter Outlook. These are observations and probabilistic forecasts—not direct measurements or guarantees of a future storm in any individual town.
The quick answer: what is happening with El Niño in October 2026?
El Niño is the warm phase of the El Niño–Southern Oscillation (ENSO), a coupled ocean–atmosphere pattern centered on the tropical Pacific. Warmer equatorial waters, changing trade winds and shifts in rainfall can rearrange the atmosphere far beyond the Pacific. An El Niño event commonly develops every two to seven years, but no two episodes produce identical weather everywhere.
NOAA’s October 8 advisory reported a Niño-3.4 sea-surface temperature index of +2.1°C and strengthening ocean–atmosphere coupling. Its forecast placed the probability of a historically strong event—defined there using a three-month relative oceanic Niño index threshold—at 83% for October–December 2026. It also favored a strong-to-very-strong event into early 2027. Those two percentage statements refer to particular forecast definitions and periods; neither means an 83% chance of a flood, snowstorm or hurricane at a specific address.
NASA’s October 15 report adds independent-looking types of evidence, though some products share the wider observation system: ocean height from the Sentinel-6 missions, sea-surface temperatures from satellites and in-water observations, and phytoplankton-related color signals from the PACE mission. NOAA’s official winter outlook then translates the state of the climate system into changes in odds for broad U.S. regions during December 2026–February 2027.
| Date / period | What was reported | What it does NOT mean |
|---|---|---|
| June 2026 | El Niño conditions became established; Sentinel-6 already saw ocean-height signals | No single satellite image diagnosed local winter storms |
| October 8, 2026 | NOAA El Niño Advisory: Niño-3.4 near +2.1°C; strong-event forecasts issued | The +2.1°C index is not the warming of every Pacific location |
| October 15, 2026 | NASA compared 2025/2026 satellite products; NOAA released U.S. winter odds | No specific blizzard or flood date was determined |
| December 2026–February 2027 | NOAA winter outlook applies to three-month U.S. conditions | Seasonal average probabilities cannot forecast a given day |
How El Niño works: the ocean-to-atmosphere chain reaction
In many neutral years, easterly trade winds help push warm surface water toward Indonesia and the western Pacific. Cooler, nutrient-rich water rises nearer the eastern equatorial Pacific, a process called upwelling. This arrangement affects where deep tropical clouds and heavy rainfall are concentrated. As trade winds weaken—or periodically reverse—warm water can migrate eastward. A deeper warm surface layer reduces eastern-Pacific upwelling, and tropical rainfall shifts with changing ocean heat and atmospheric circulation.
The atmosphere then feeds back on the ocean. Changed pressure gradients can weaken the trades further, reinforcing the eastward redistribution of warm water. Scientists examine both the ocean and the atmosphere because one isolated warm patch of water is not the whole ENSO system. NOAA looks at temperature indices, subsurface heat, winds and tropical convection to assess the event.
These tropical rearrangements interact with the jet stream, storm tracks, drought and precipitation across remote regions. But regional weather is still influenced by other patterns, from the North Atlantic Oscillation to the Indian Ocean Dipole. That is why even a strong El Niño can be accompanied by unexpected local rainfall or cold spells.
What NASA’s satellites actually reveal
The most useful way to read the new NASA material is to treat its three map layers as three different measurements, not three interchangeable pictures of future rainfall. For the original side-by-side and animated visuals, open NASA’s Scientific Visualization Studio: Signs of El Niño in 2026. The animations compare similar parts of 2025 and 2026; the colors are defined for each variable.
1. Sentinel-6: an unusually high sea surface can signal redistributed warm water
The Sentinel-6 altimeters measure sea-surface height using radar. During El Niño, Kelvin waves and shifting warm water can lift the sea surface in the central and eastern equatorial Pacific. The same ocean can sit relatively lower toward the western Pacific. NASA’s October 15 feature describes local changes approaching approximately 30–40 centimeters in parts of the east and lower levels of about 15–20 centimeters around Indonesia and northern Australia in the evolving event. These are localized departures within the satellite analysis, not a forecast of coastal flooding at those heights.
Why height changes? Seawater expands as it warms, and currents redistribute its mass. Height anomalies therefore reveal information about heat content and ocean motion that a surface thermometer alone would miss. The satellite measures height relative to a reference; the map does not say that an individual beach is about to receive a 40-centimeter storm surge. Tides, weather, coastline shape and local sea level must be assessed separately.
2. Sea-surface temperature: a warm anomaly is a difference from normal
The familiar red band across the equatorial Pacific represents water warmer than a defined long-term baseline. NASA integrates satellite and in-water measurements to describe these changes. An anomaly of +2°C is not a 2°C ocean temperature; it means the measured temperature is two degrees above the baseline for that place or index. Different baselines, geographical boxes and monitoring methods produce different numeric values.
For example, NOAA reported a +2.1°C Niño-3.4 index in early October, while NASA discussed roughly 1.7°C warming for an eastern-Pacific context in its separate presentation. These statements should not be forced into one number. NOAA’s regional indices cover differently located ocean boxes, and NASA’s map highlights spatial patterns. Read the label, location, time average and baseline before comparing a quoted anomaly with another.
3. PACE ocean color: the blue shift reveals an ecological response
NASA’s PACE satellite carries the Ocean Color Instrument, which records light at hundreds of wavelengths. Researchers derive a measure called apparent visible wavelength from the spectrum. In the 2026 imagery, parts of the equatorial Pacific show a shift toward bluer water compared with 2025. NASA connects this to a reduction in phytoplankton-related greenness where weakened upwelling limits nutrient supply.
This is scientifically important because phytoplankton sit at the base of marine food webs. A reduction in nutrients and microscopic algae can affect fish feeding and fisheries, although ocean color alone is not a catch forecast for a particular port. Cloud conditions, suspended material, water types and the satellite product must also be considered. The point is that El Niño is not only about the weather above the sea; it also changes what is happening within the ocean.
| NASA data layer | What is being measured | Useful conclusion | Common wrong conclusion |
|---|---|---|---|
| Sea-surface height anomaly | Water level relative to a reference from satellite altimetry | Tracks redistribution of warm water and Kelvin waves | The map predicts the storm-surge height at a named beach |
| Sea-surface temperature anomaly | Surface heat relative to a baseline | Shows where Pacific waters are unusually warm | Red color means the sea is the same temperature everywhere |
| Apparent visible wavelength (PACE) | Spectral ocean-color indicator | Can reveal phytoplankton-related ecosystem change | Blue automatically means polluted water or dead ocean |
| Seasonal precipitation outlook (NOAA) | Forecast probabilities from climate modeling and observations | Shows above-/near-/below-normal odds over months | The colors give the rain total for a specific day |
What NOAA forecasts for U.S. winter 2026–27
NOAA’s October 15 U.S. Winter Outlook covers December 2026 through February 2027, the standard meteorological winter in the Northern Hemisphere. El Niño is a major influence in this forecast, but the maps summarize all of the agency’s available climate evidence. They do not tell a traveller what the roads will be like on a specific January morning.
In broad terms, NOAA favors above-average temperatures across much of the northern United States and significant parts of the East. Wetter-than-average conditions are favored from the Southwest through much of the South and along the East Coast. Some northern and western regions have higher odds of a drier season. There are important exceptions, and neutral-looking areas are not promised average weather.
| Region | Temperature signal in NOAA October 15 outlook | Precipitation signal | Reader implication |
|---|---|---|---|
| Pacific Northwest and northern Rockies | Warmer-than-average temperatures favored in much of the region | Drier signal in parts of northern Mountain West | Plan for both changing snow levels and possible water-management concerns |
| California and Southwest | Northern California warmth favored; Southwest temperature odds mixed | Wetter conditions more likely across Southwest | Check flood and atmospheric-river forecasts nearer each event |
| Southern Plains and Gulf Coast | Varies across states; portions have no dominant temperature category | Wetter odds elevated across southern tier | Flood preparedness useful even if drought relief is possible |
| Midwest and Great Lakes | Above-average temperature odds favored in broad areas | Drier odds in parts of Great Lakes; regional variation | Do not turn milder seasonal odds into a no-snow prediction |
| Southeast and Florida | Parts of Southeast lean near normal; state-specific differences | Wetter signal across southern tier and East Coast | Review local flood and severe-weather guidance |
| Eastern Seaboard | Warmth favored across much of East | Wetter probabilities along East Coast | Storm specifics remain a short-range forecast task |
| Alaska, Hawaii and territories | Different regional patterns; NOAA notes Alaska warmth favored in places | Some areas lean drier; consult local products | Mainland US generalizations are not transferable |
Why a warmer winter can still bring snow
A three-month seasonal average can be warmer than normal while particular weeks become very cold. Snow needs the right combination of moisture, temperatures at multiple atmospheric levels and storm tracks. El Niño may influence the odds of a stormier southern tier, but it cannot supply a reliable snowfall total for Boston, Chicago, Denver, London or a particular ski resort months in advance. Elevation and the snow–rain line can make neighboring mountain towns experience very different outcomes during the same storm.
One concrete example: if a city typically experiences several mild weeks and one sharp cold snap, a winter that is milder overall can still contain a disruptive freeze. The seasonal mean reflects all those days; emergency planning depends on the actual forecasts and alerts closer to the event. This simple distinction helps readers avoid claims such as “El Niño means no snow in the North” or “the South is guaranteed record snowfall.”
What about flooding, drought and wildfire risk?
NOAA expects drought to improve or end in several regions, including parts of the Southwest, Southern Great Plains, Southeast and East, but favors drought development or worsening in areas of the northern Rockies and portions of the inland Northwest. More precipitation can help reservoirs and soils, yet intense rain on dry or burned terrain may increase runoff, flash-flood or debris-flow hazards. The same seasonal signal can bring benefits and risks, depending on storm intensity, local drainage and antecedent conditions.
For a homeowner, the correct response is not to assume flooding will occur on a particular date. It is to identify local hazards: floodplain exposure, vulnerable basement entrances, sloped ground below burn scars and stormwater drainage. Then monitor official watches and warnings when individual storms approach. A region-wide seasonal outlook provides context, not a personalized hazard notification.
What does El Niño mean for the UK and Ireland?
The UK has a more indirect relationship with tropical Pacific conditions than many parts of the United States. In its October 5 analysis, the UK Met Office explicitly challenged sensational “super El Niño” winter headlines. El Niño can increase the likelihood of wetter, stormier and often milder conditions in late autumn and early winter in the UK. Farther into winter, interactions with the stratospheric polar vortex may change the balance of cold-weather risks. But those are risk tendencies, not a deterministic recipe for blizzards or named storms.
A major obstacle to long-range UK forecasting is that several other atmospheric patterns strongly influence the eventual outcome. The Met Office September long-range discussion specifically distinguishes chances of an unsettled period from knowledge of where and when an individual storm will hit. Residents should use its current long-range outlook for seasonal context and its local forecasts and official warnings for near-term planning. The same cautious principle applies to Ireland; UK maps are not a replacement for Ireland’s national forecast service.
Practical UK interpretation: if seasonal guidance favors a wetter, windier early winter, it is reasonable to inspect gutters, garden drainage and roof condition beforehand. It would not be reasonable to cancel a specific December journey solely because a social-media post claims El Niño guarantees nationwide snow. The probability of a seasonal pattern and the probability of a disruptive event on your travel date are different quantities.
Australia’s spring and summer: why “strong El Niño means drought everywhere” is wrong
Across the Southern Hemisphere the seasonal calendar is different. October–December is spring into summer in Australia, not winter. Historically, El Niño often favors drier conditions in parts of eastern and northern Australia during winter and spring. Yet the Australian Bureau of Meteorology warns that the strength of an El Niño does not automatically set the size or direction of local rainfall impacts. Other climate drivers can offset or reinforce the ENSO signal.
That warning is especially relevant in 2026. The Bureau’s October 1 long-range outlook favored above-average October–December rainfall over much of western and central Australia, while favoring below-average rainfall in parts of the far north and southeast; much of eastern Australia had a more mixed outlook. Daytime and overnight temperatures were broadly favored to be above average. It would therefore be wrong to apply one “El Niño drought map” to every Australian state.
For readers comparing headlines across countries: a record-strength ocean temperature signal can coexist with above-average local rainfall in some regions. The underlying physics is global, but rainfall also depends on pressure patterns, the Indian Ocean Dipole, the Southern Annular Mode and regional moisture flows. Always read the Bureau’s current outlook map for your own district rather than inferring conditions from the Pacific index alone.
How to read an official seasonal outlook: five-minute guide
Long-range products often look more precise than they really are because they use confident colors and percentages. NOAA commonly divides a historical seasonal distribution into three categories—below normal, near normal and above normal. A probability forecast then shifts the odds toward one or more of those categories for a particular area. The wording can be confusing, so use this short method whenever a headline quotes a seasonal probability.
- Step 1 — Identify the variable. Is the map about seasonal mean temperature, total precipitation, drought or ENSO strength? Those are different outcomes.
- Step 2 — Read the valid dates. A December–February map should not be used as a forecast for October or for a single February weekend.
- Step 3 — Find your exact area. “The U.S. South” includes very different climates. State and local probability contours matter.
- Step 4 — Check what the percentage refers to. A 50% chance of above-normal rainfall is not 50% more rain, and it is not a 50% chance of a flood.
- Step 5 — Match the decision to the forecast horizon. For home preparation use the seasonal outlook; for travel dates use the 7–10-day forecast; for urgent action follow watches, warnings and nowcasts.
Worked example: what “50% chance of above-normal rainfall” really means
Imagine a hypothetical seasonal outlook assigning 50% to above-normal rainfall, 30% to near-normal rainfall and 20% to below-normal rainfall. These numbers sum to 100%; they are an illustration, not a quoted probability for any U.S. county in October 2026. In a perfectly reliable set of many comparable forecast situations, roughly half would finish in the wettest historical third. But the “wettest third” can be just slightly wetter than normal or dramatically wetter; the outlook has not told you how many inches of rain will fall.
The same arithmetic explains why a high probability of an unusually strong ENSO event does not mean a high probability of a particular local disaster. Those events are linked, but the connection passes through many other variables and timescales. Do not transfer an 83% figure from NOAA’s ENSO strength forecast into a headline about a snow day, insurance claim or flood.
| Headline or map label | Correct interpretation | What you cannot infer |
|---|---|---|
| 83% chance of historically strong El Niño in Oct–Dec | An 83% modeled probability for a defined climate-index outcome | An 83% chance your house will flood |
| 50% above-normal seasonal rainfall (hypothetical) | Above-normal category favored for seasonal total | 50% extra rain or rain on half the days |
| Equal chances on a map | No single tercile outcome sufficiently favored | Exactly average temperature or precipitation |
| Warmer-than-average winter favored | The three-month mean is statistically more likely to be above normal | No freezing nights or snow |
| Satellite sea surface 30 cm higher in an area | Ocean-height anomaly in a specific measured ocean region | A 30 cm coastal flood alert for your town |
A practical source-checking workflow: what to bookmark and when
Here is an original, repeatable workflow that turns all this information into decisions without inventing your own seasonal forecast. It combines four agencies with different responsibilities: observing the ocean, diagnosing ENSO, projecting seasonal anomalies and issuing local weather alerts. You can complete the initial reading in under ten minutes if you already know your location.
- Start with the diagnosis: check NOAA CPC’s monthly ENSO discussion for the ENSO alert status, index values and probabilities. Note the bulletin date.
- See the ocean evidence: open NASA’s 2026 visualization and compare the three map variables with the legend. This explains what changed rather than predicting your personal weather.
- Check the seasonal outlook in the right country: US readers use NOAA’s winter outlook and updated CPC maps; UK readers use Met Office long-range guidance; Australian readers use Bureau outlook maps.
- Narrow the horizon: when a decision is a week away, switch to your local national weather service or its official app; seasonal forecasts cannot pick exact storm days.
- Act only on supported hazards: prepare for common local risks and respond to official alerts. Save the date, source and exact wording when sharing the forecast with someone else.
Case study: three different decisions from the same El Niño
Scenario A — A homeowner in Arizona. NOAA favors a wetter seasonal signal across the Southwest. The useful action is to inspect drainage before the season and watch for locally issued flash-flood guidance near heavy rain. It is not to assume every Arizona day will be rainy. In dry regions, runoff can rise rapidly after intense downpours even when the seasonal total is only moderately above average.
Scenario B — A commuter in northern England. The Met Office sees potential for unsettled and wetter conditions in late autumn and early winter, but cannot identify a particular storm months out. The useful action is to check regional transport and wind alerts shortly before travel, with a sensible contingency plan—not to buy equipment based on an unverified “polar vortex” prediction.
Scenario C — A farmer in western Australia. A simple El Niño stereotype might suggest universal drought. The Bureau’s October seasonal forecast instead favors wetter-than-average conditions across substantial western and central regions. The correct action is to compare local rainfall outlooks with soil moisture, crop stages and regional advisories, not rely on a global “super El Niño” banner.
How the satellites and forecast models fit together—and where uncertainty remains
Satellites can show that an event is developing, but they do not single-handedly generate a seasonal weather forecast. NASA’s observations complement weather stations, ships, floats, buoys and other atmospheric records. NOAA and international forecast centers initialize physical climate models, run ensembles and evaluate how the coupled ocean–atmosphere system may evolve. These model predictions support probabilistic regional outlooks.
Ensembles matter because small differences in initial conditions and model processes can change the eventual outcome. NOAA’s Geophysical Fluid Dynamics Laboratory provides experimental October 2026 El Niño predictions using multiple model runs. Its description explicitly notes increasing uncertainty as the forecast extends into spring and summer 2027. A forecast for the broad direction of ENSO can therefore be more confident than a forecast for one location’s rain total.
There is also a distinction between the signal and the realized impact. If the Pacific strengthens toward a historic peak, that raises confidence in some characteristic large-scale patterns; it does not erase the influence of the North Atlantic Oscillation, blocking highs, atmospheric rivers, terrain or local storms. The Bureau of Meteorology makes this distinction unusually clearly in its explanation of the 2026 event.
Seven misleading claims about El Niño—and how to check them
Claim 1: “A satellite photo proves the biggest winter storm is coming”
A satellite may show unusually warm tropical water or changed sea level, but neither directly predicts the timing of an individual snowstorm in your town. Ask for an official forecast with a location, time period and probability. If the headline has only a dramatic ocean image, it has not established the local impact.
Claim 2: “Super El Niño guarantees a terrible winter”
“Super El Niño” is a popular label for a very strong event; it does not represent a universal hazard category that automatically means worse conditions everywhere. Some areas may experience more rain; others may be drier or warmer. Any severity claim requires geography, a specific hazard and an agency source.
Claim 3: “A warmer winter means there will be no freezing weather”
Warmer seasonal averages can coexist with snow, ice and unusually cold individual days. This is especially relevant for winter travel and home heating. For useful preparation rather than sensational temperature claims, our related guide explains why a heat pump may run continuously in winter and which symptoms are more meaningful than operating hours alone.
Claim 4: “El Niño caused every flood or wildfire this year”
ENSO can shift the probabilities of climate conditions, but assigning cause to an individual event requires event-specific meteorology and, where appropriate, a formal attribution analysis. Land management, vulnerability, background warming and chance also contribute. A pattern increasing risk is not proof of sole causation.
Claim 5: “Australia will be dry in every state”
The October Bureau outlook contradicts that blanket statement. Rainfall prospects vary between districts, and some regions favor above-average conditions. Verify the map for the correct Australian months before using an ENSO stereotype.
Claim 6: “NASA’s blue sea means it is safer or colder everywhere”
In the PACE visualization, shifting blue hues are related to changes in the spectral color of the water and associated phytoplankton signals. Other satellite maps may use blue to mean negative sea-level or temperature anomalies. The color itself carries no universal meaning; the legend and sensor product do.
Claim 7: “83% chance of strong El Niño means 83% chance of floods”
No. The first is a forecast of ENSO intensity under a defined climate index and time average. The latter would require a separate, local hazard model and forecast. Treating them as interchangeable is a probability error, not a cautious interpretation.
What households and travellers can do now without overreacting
Preparedness should be matched to known local exposures, not global predictions. A household that has flooded before should inspect basement drainage and sump equipment; a household in a winter-storm-prone region should verify safe heating, power backup and communication arrangements. Travellers should consider flexible schedules and track official alerts as departure dates approach. These measures are reasonable even if the season eventually behaves differently from the early outlook.
- Flood and heavy rain: clear accessible drains and gutters safely, check flood-risk maps and understand local evacuation notices. Do not enter floodwater.
- Snow and cold: maintain heating equipment, protect exposed plumbing, keep essential supplies and know the difference between a watch and a warning.
- Wildfire and dry weather: follow regional fire restrictions and air-quality advisories; avoid assuming that a wet national outlook eliminates local fire risk.
- Coastal activities: use actual marine forecasts, tide information and warnings—not basin-wide satellite-height anomaly images—as operational guidance.
- Travel and events: check the relevant local forecast closer to the event, monitor transport operators and have a flexible backup plan where practical.
- Information hygiene: save original agency links and the publication date; many recycled ENSO stories quote an outdated probability from a previous month.
The bottom line: strong signal, different local outcomes
NASA’s October 2026 images show an unusually consequential ocean event developing across the equatorial Pacific: higher eastern-Pacific sea surfaces, warm-water anomalies, and measurable ecosystem-related color changes. NOAA’s October advisory and winter outlook indicate that this event may substantially shift seasonal weather odds across the United States. The UK Met Office and Australia’s Bureau of Meteorology also describe meaningful potential influences—while warning against turning a large-scale climate signal into specific, guaranteed local outcomes.
The most valuable takeaway is a repeatable method: read the observation, check the variable and baseline, identify the forecast period, interpret the probability correctly and follow local warnings when a real hazard develops. That approach works long after a dramatic 2026 headline has disappeared.
Original agency sources and data to explore
- NASA (Oct. 15, 2026) — NASA Satellites Observe Historic 2026 El Niño — explains Sentinel-6, temperature and PACE ocean-color observations.
- NASA Scientific Visualization Studio (Oct. 15, 2026) — Signs of El Niño in 2026 — the animated 2025-versus-2026 comparisons.
- NOAA Climate Prediction Center (Oct. 8, 2026) — ENSO Diagnostic Discussion — official monitoring, Niño indices and strength probabilities.
- NOAA (Oct. 15, 2026) — U.S. Winter Outlook — U.S. seasonal temperature, precipitation and drought probabilities.
- NASA GPM (Oct. 12, 2026) — Global Precipitation During July to September — example of near-real-time global precipitation observations.
- UK Met Office (Oct. 5, 2026) — Review of sensational El Niño winter headlines — UK forecast uncertainty explained.
- Australian Bureau of Meteorology (Oct. 1, 2026) — October–December long-range outlook — region-specific rainfall and temperature signals.
- Australian Bureau of Meteorology — Southern Hemisphere ENSO monitoring — current index and atmospheric conditions.
- NOAA GFDL (Oct. 7, 2026) — Experimental ENSO prediction ensembles — uncertainty in expected evolution.
You may also like
 Science & Discoveries
James Webb Finds Metal-Rich Gas Around the Milky Way’s Black Hole: What It Means
James Webb observations reveal metal-rich gas near Sagittarius A*. Here is what the finding means, how infrared spectroscopy…
 Science & Discoveries
NASA Found a Giant Musical Symbol in Space: The Science Behind the Cosmic Treble Clef
NASA’s Treble Clef is a distant radio phoenix, not music in space. Learn how black-hole plasma and galaxy-cluster…
 Science & Discoveries
Why Some Ancient Roman Buildings Have Survived for 2,000 Years
The real science behind Roman concrete, the Pantheon, volcanic ash, hot mixing and self-healing cracks—and why ancient buildings…