
Climate Prediction Center Heavy Snow Map: November Outlook
Read NOAA’s November heavy-snow outlook, see the mountain areas at risk, understand the map’s limits, and find local forecasts and road checks.
Contents
- Where does the latest outlook show heavy-snow risk?
- What do “slight” and “moderate” mean?
- Read the map in this order
- Why a mountain outlook does not settle a city forecast
- An outlook is different from a winter storm warning
- California mountain roads: check controls before departure
- A useful checklist for the next update
- Can this map tell me how many inches will fall?
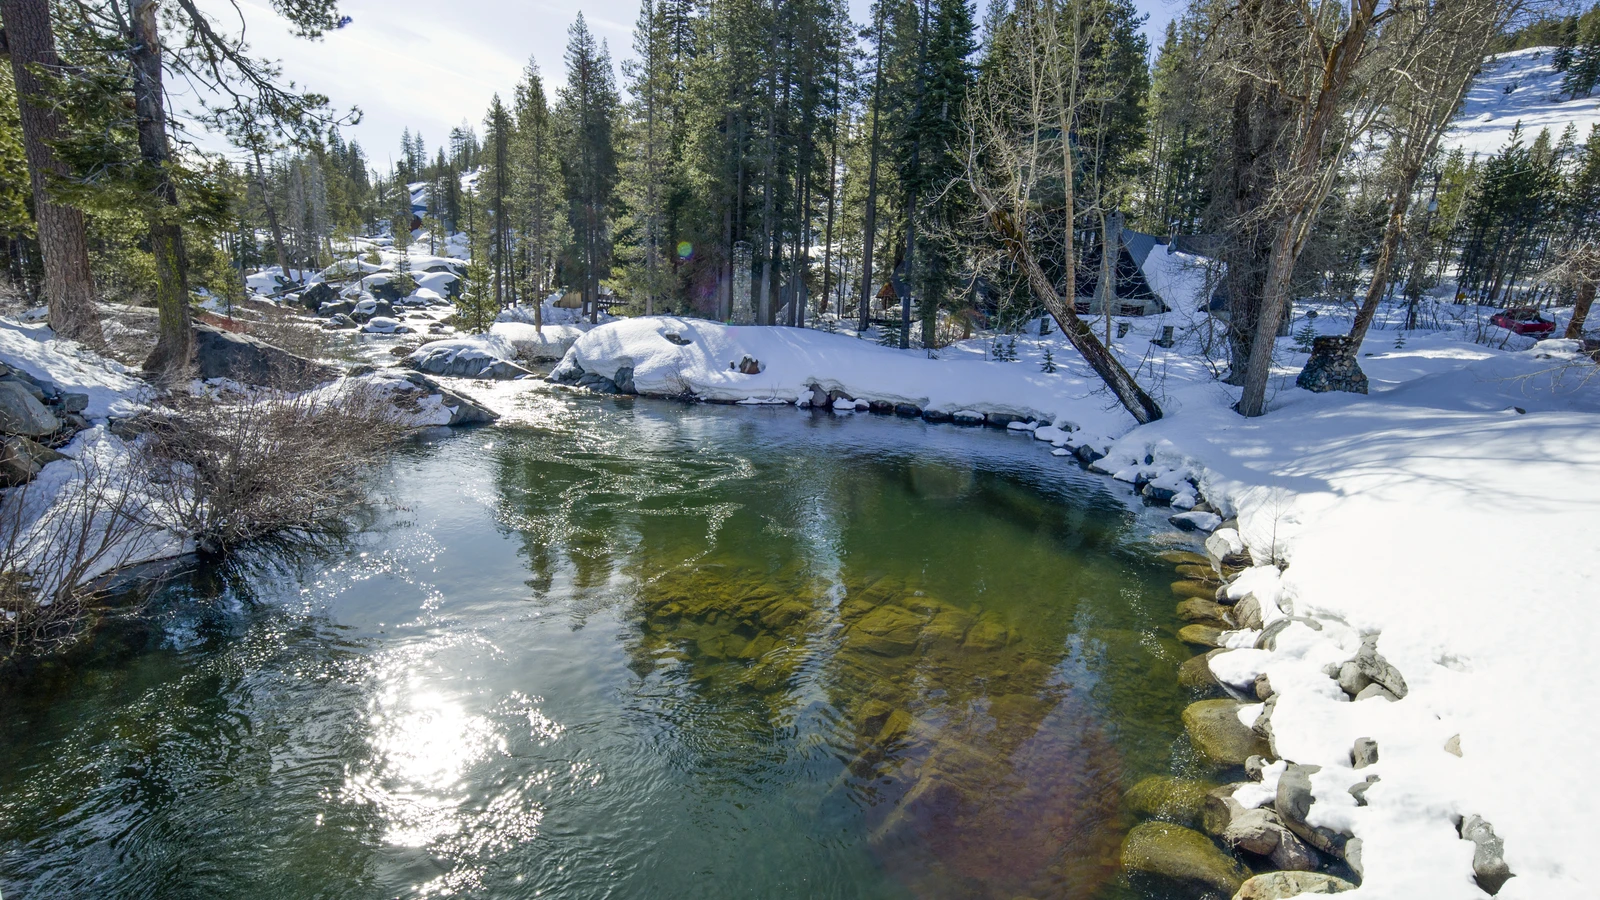
NOAA’s Climate Prediction Center identifies a moderate risk of heavy high-elevation snow in the Klamath and Sierra Nevada mountains on November 14–15, 2026. The outlook is an early indication of a potential hazard—not a forecast that every city in California or Oregon will receive heavy snow.
This guide explains the map, its dates and risk categories, then shows where to check local forecasts and mountain-road restrictions. Reviewed November 7, 2026, using the outlook issued at 3 p.m. EST on November 6. The embedded map is a dated snapshot; use the official links for later updates.
Where does the latest outlook show heavy-snow risk?
The official CPC outlook covers November 14–20, but individual hazards have shorter windows within that week.
| Area described by CPC | Snow-risk category | Dates in the November 6 outlook |
|---|---|---|
| Higher elevations of the Klamath and Sierra Nevada mountains | Moderate | November 14–15 |
| Higher elevations of the Cascades, Klamath and Sierra Nevada | Slight | November 14–17 |
| Parts of the Northern Intermountain region, Great Basin, and Central and Northern Rockies at high elevations | Slight | November 14–17 |
These are regional hazard areas. They do not establish a snowfall total for a particular mountain pass, ski resort or neighborhood.
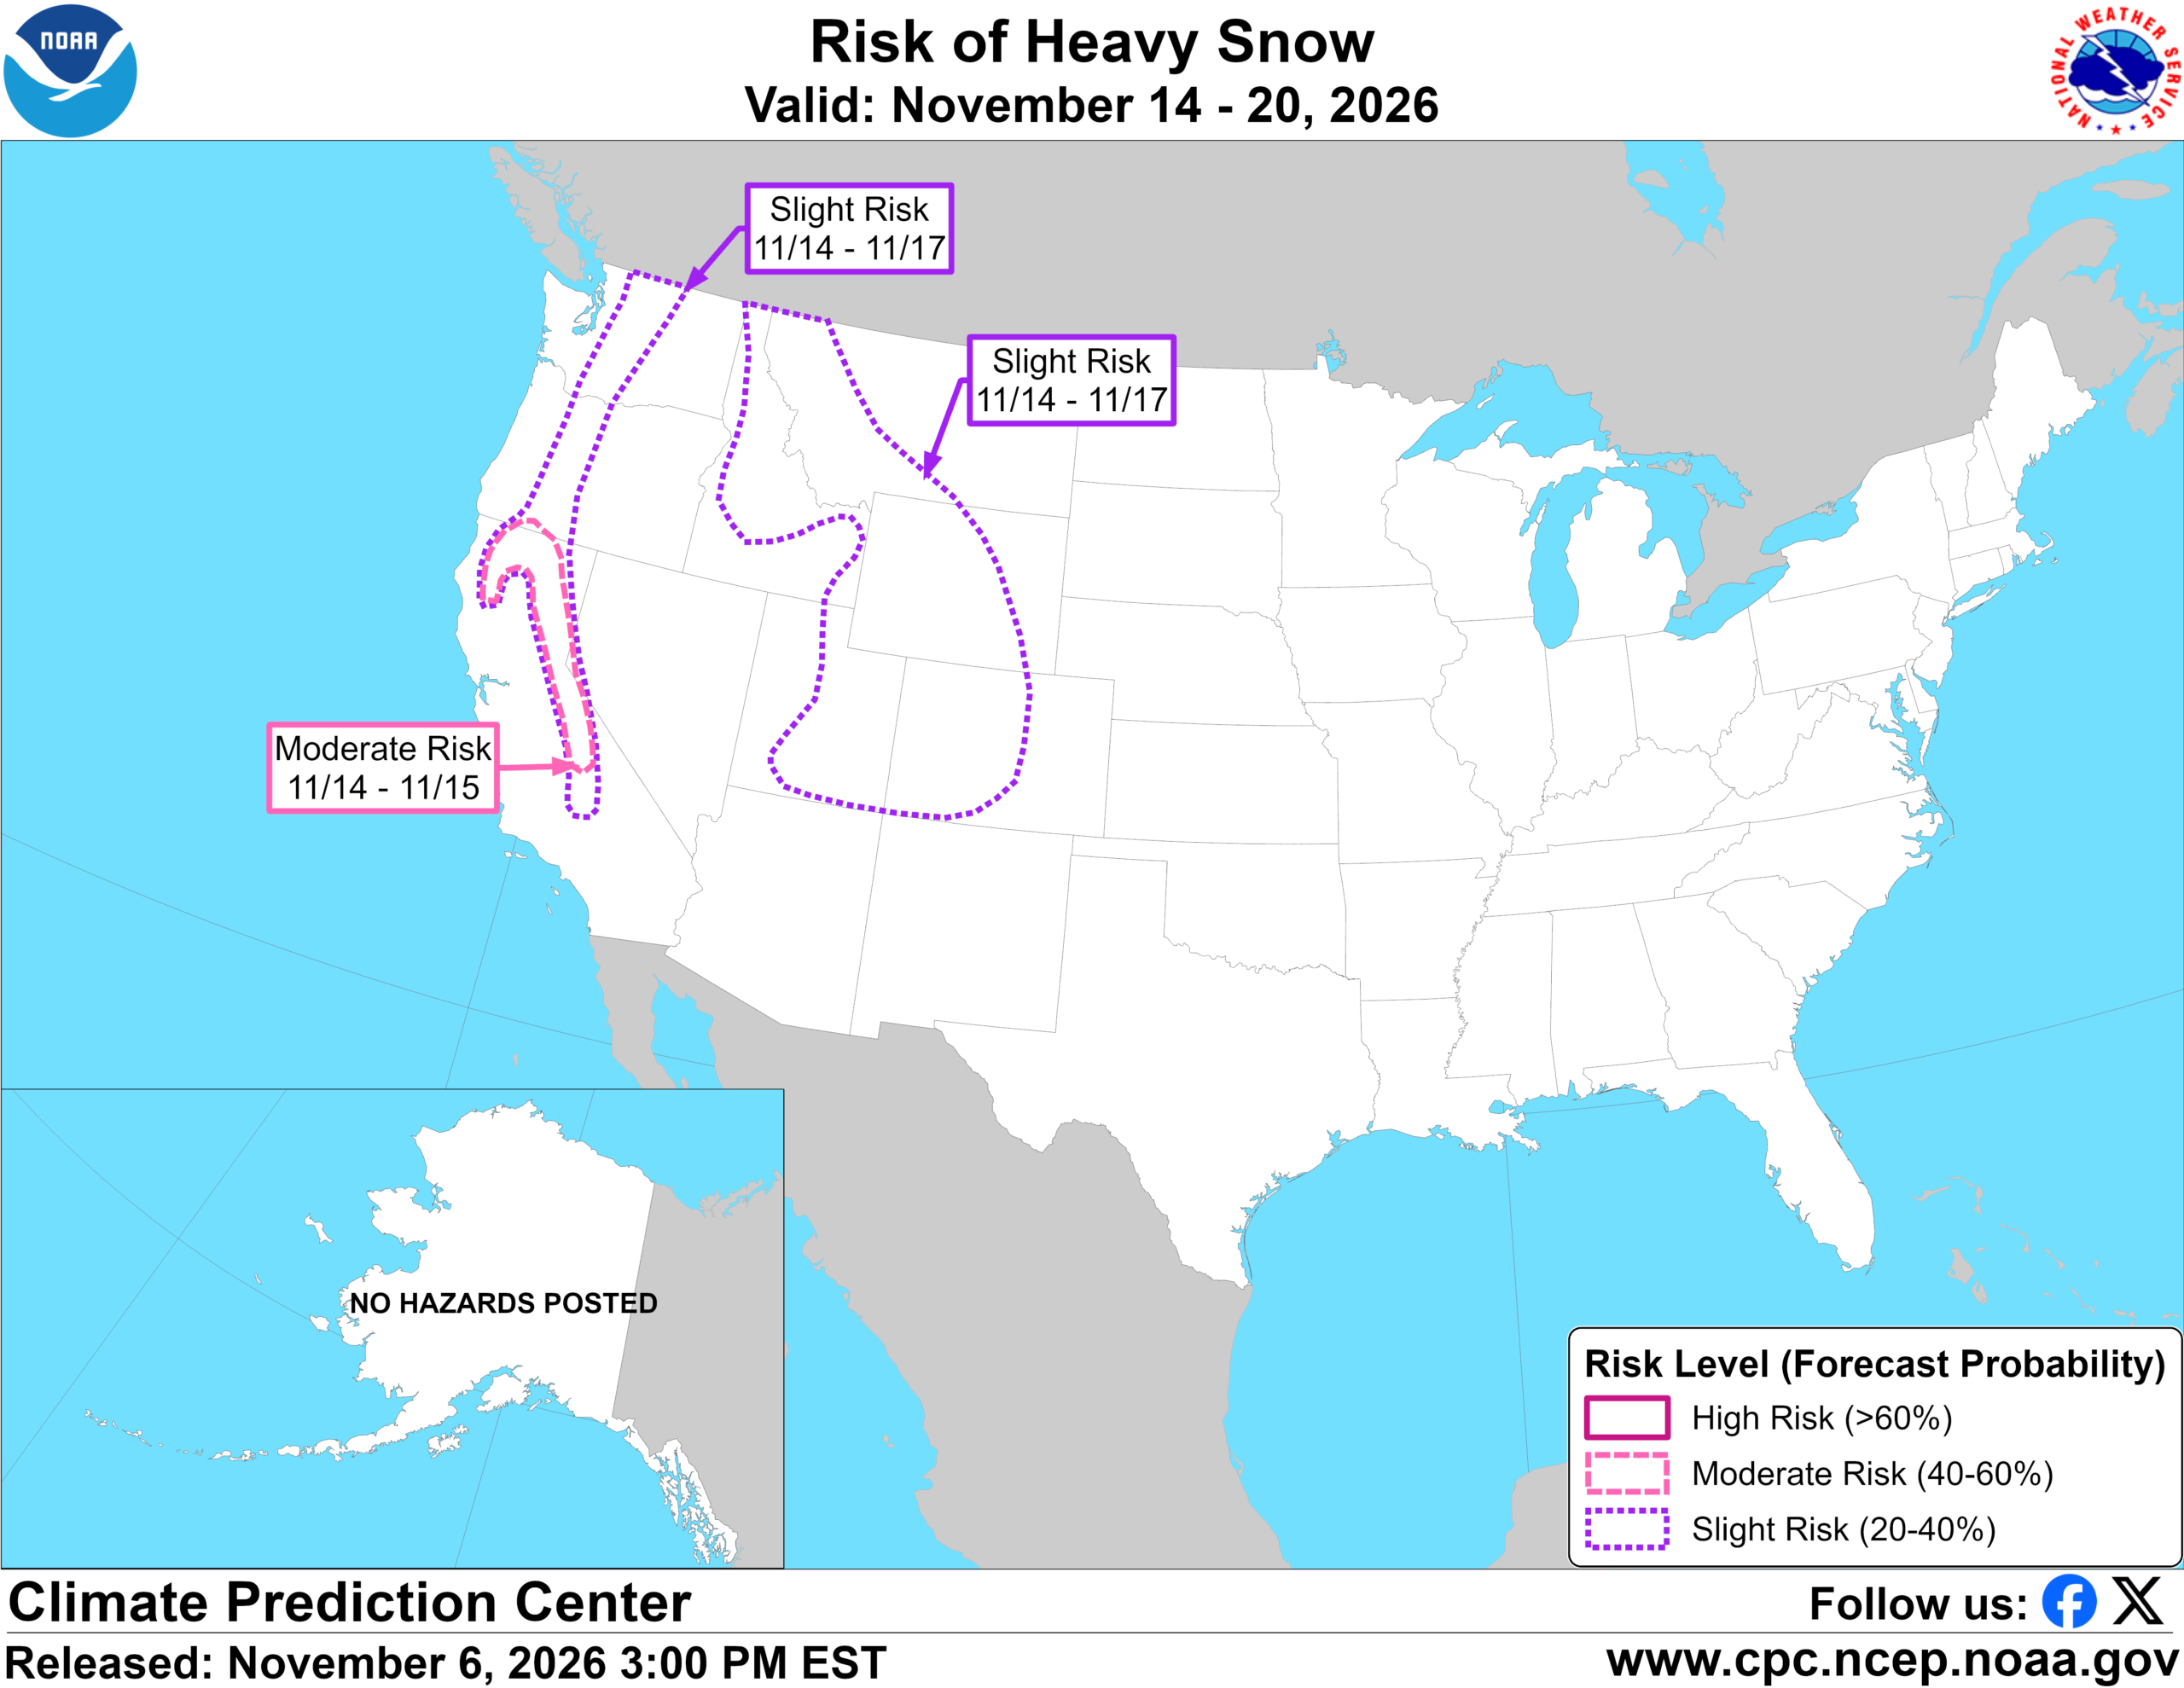
The original NOAA snow-risk graphic is reproduced above with its dates and legend intact. The source URL updates as forecasts change; this copy preserves the November 6 version.
What do “slight” and “moderate” mean?
The displayed map labels slight risk as 20–40%, moderate as 40–60%, and high as greater than 60%. These are probabilities associated with the product’s heavy-snow hazard, not expected percentages of a state covered in snow.
CPC’s product description explains that the week-two outlook is designed to provide advance notice of potentially significant hazards eight to fourteen days ahead. The heavy-snow assessment considers precipitation, temperatures favourable for snow and snow-water-equivalent guidance. It is not simply a probability of seeing any snowflake.
Imagine two hypothetical forecasts. One gives a location a good chance of brief flurries; another gives it a lower chance of a disruptive mountain snow event. Those describe different outcomes. A heavy-snow hazard map should not be compared directly with a phone app’s chance of precipitation without checking what each number measures.
Likewise, a moderate category does not mean “half a metre of snow,” and a slight category does not mean harmless conditions. Probability, snowfall amount and consequences are separate questions.
Read the map in this order
- Find the issue date. A screenshot shared today may contain an older outlook. Here, the release line is November 6, 2026.
- Read the overall validity period. The map covers November 14–20; that is not its publication date.
- Read the label beside the hazard area. The moderate snow area is marked November 14–15, a narrower period than the whole map.
- Check the legend. On this particular graphic, dashed pink marks moderate risk and dotted purple marks slight risk. Other weather products use different colours and definitions.
- Read the accompanying discussion. Place names and high-elevation qualifications matter more than a headline listing entire states.
The question to ask is not only “Is my state inside the outline?” Ask whether your destination or route involves the terrain and dates described. A state boundary is a convenient label; it is not a promise of uniform weather within it.
Why a mountain outlook does not settle a city forecast
A journey can begin and end at lower elevations while crossing substantially higher terrain between them. Checking only the weather at the departure city can therefore miss the location most relevant to the drive.
For a hypothetical trip across a mountain pass, check three points: the start, the highest part of the route and the destination. Match the forecast to the expected travel time at each point. A dry-looking forecast at home does not answer whether conditions at the pass will be suitable later that day.
At this forecast range, avoid presenting an exact snow line or a precise accumulation for a resort unless a current, location-specific official forecast supports it. The regional map alone supplies neither.
An outlook is different from a winter storm warning
The National Weather Service warning guide says winter warnings, watches and advisories are issued by local offices using local criteria. A Winter Storm Watch concerns conditions favourable for a significant winter event. A Winter Storm Warning concerns a significant event expected or occurring, with potentially serious travel impacts.
The CPC map is an extended-range planning product. It should not be relabelled as a local warning, evacuation instruction or road-closure notice. Conversely, the absence of a coloured CPC area does not certify that a particular road will be free of ice or snow.
As your journey approaches, open weather.gov, search for the relevant destination or route location, and read any active alert in full. Check its area, start and end times, expected impacts and instructions. A regional outlook can flag what to monitor; the local forecast and warnings provide the next level of detail.
California mountain roads: check controls before departure
Use Caltrans QuickMap for road conditions and consult the official chain-control rules. The November outlook does not establish that a particular highway is closed or that chain controls will definitely be imposed on a named date.
Caltrans distinguishes several control levels. At R2, the exemption from fitting chains or traction devices applies to four-wheel/all-wheel-drive vehicles with snow-tread tires on all four wheels; those vehicles must still carry traction devices in chain-control areas. At R3, traction devices are required on all vehicles, with no exceptions.
Follow posted signs and directions from Caltrans or California Highway Patrol personnel. Check your vehicle manufacturer’s instructions for compatible traction devices before you need them; Caltrans specifically advises consulting those specifications. All-wheel drive should not be interpreted as a universal exemption.
For Oregon travel, use the state’s TripCheck road and weather map. Do not assume California’s control labels or exemptions apply unchanged across the state line.
A useful checklist for the next update
- Save the original CPC link, rather than relying on a cropped social-media image.
- Record the issue date, hazard dates and locations before comparing two forecasts.
- Check local NWS forecasts and warnings as the trip approaches.
- Review the relevant state transport service immediately before departure.
- Keep plans flexible if official alerts or restrictions change.
This outlook also answers a different question from whether there will be snow on the ground on December 25. For that distinction, see our guide to NOAA’s white-Christmas map and what it can predict.
Can this map tell me how many inches will fall?
No. The reproduced graphic shows heavy-snow risk categories and dates, not a location-specific accumulation forecast. Use the latest local NWS forecast for the place and travel period you actually need, and keep the map’s issue date attached whenever sharing it.
Featured photograph: historical Sierra Nevada snow, April 17, 2012, by Dale Kolke / California Department of Water Resources, via Wikimedia Commons, CC BY-SA 4.0. Cropped and converted to WebP; the adaptation shares the same licence. It does not depict November 2026 conditions. Inline map: NOAA/NWS Climate Prediction Center, issued November 6, 2026; converted losslessly to WebP without changing the forecast, dates or legend. Reproduction does not imply NOAA endorsement.
You may also like
 Science & Discoveries
UK November Cold Snap: What the Met Office Forecast Says
What the Met Office forecast says about the UK November cold snap, possible northern wintry showers, frost and…
 Science & Discoveries
Altermagnetism Explained: What the New Evidence Shows
What is altermagnetism? Understand the new MnTe experiment, how it differs from other magnetic orders, and what the…
 Science & Discoveries
White Christmas 2026: What Can We Actually Predict?
Can we predict a white Christmas in 2026? Learn to read NOAA’s historical snow map, understand the winter…