
White Christmas 2026: What Can We Actually Predict?
Can we predict a white Christmas in 2026? Learn to read NOAA’s historical snow map, understand the winter outlook and check a local forecast at the right time.
Contents
- What counts as a white Christmas?
- Three products that answer three different questions
- What NOAA’s 2026–2027 winter outlook says
- How to use NOAA’s historical white-Christmas map
- Where history favors snow—and why a city percentage needs care
- A worked probability example without invented city data
- When should you check the actual Christmas forecast?
- How to compare conflicting Christmas predictions
- What you can decide now
- Sources, dates and image credits
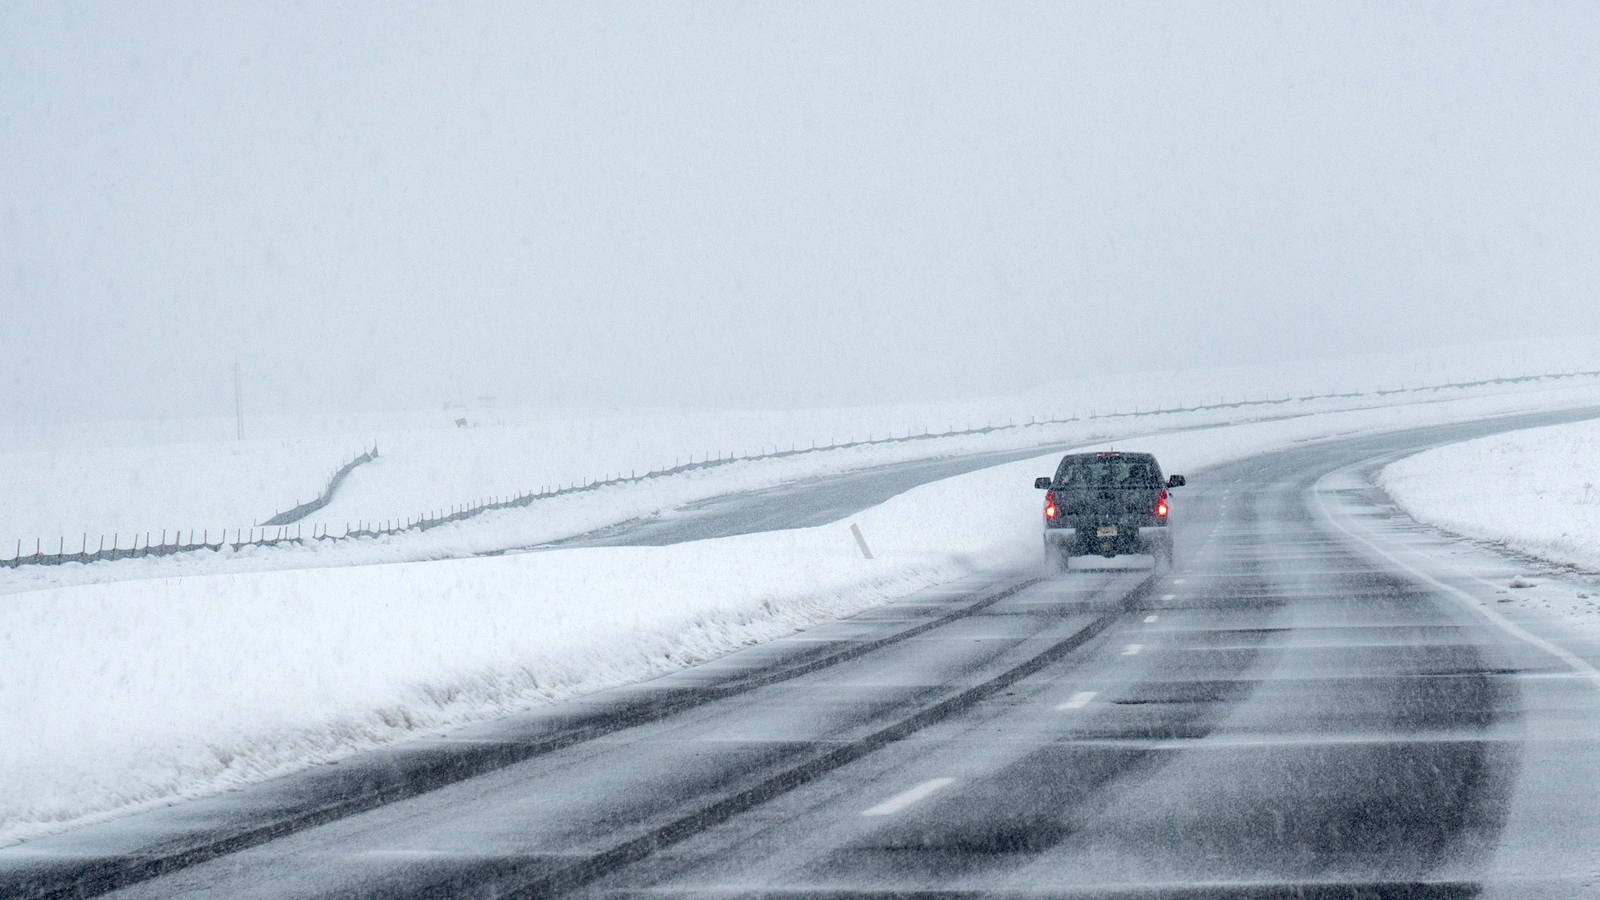
It is too early on 3 November to give a dependable local snow forecast for Christmas Day 2026. What you can check now is a location’s historical chance of snow on the ground and the broad winter outlook. Those answer different questions from whether snow will fall at your address on December 25.
For the United States, the useful distinction is between climatology, a seasonal outlook and a local weather forecast. This guide shows how to use each without turning a historical percentage into a promise. It covers U.S. conditions; definitions and services used elsewhere can differ.
What counts as a white Christmas?
NOAA’s historical white-Christmas maps measure the chance of at least one inch of snow on the ground on December 25. Snow does not have to fall that day. The NOAA explanation describes the map as a guide based on past conditions, rather than a forecast for a particular Christmas.
Imagine two hypothetical Christmas mornings. In the first, three inches remain from a storm on December 22, but the sky is clear. In the second, a few flakes fall and immediately melt on bare ground. The first can meet the snow-depth threshold; the second does not simply because somebody saw falling flakes.
That difference matters when comparing headlines. Before reading a “snow chance,” check whether it refers to falling snow, measurable snowfall, snow depth or any wintry precipitation. These are not interchangeable outcomes.
Three products that answer three different questions
| Product | Question it helps answer | What it cannot establish |
|---|---|---|
| Historical white-Christmas map | How often did this location have enough snow on December 25 in the reference period? | The outcome for Christmas 2026 |
| Seasonal winter outlook | Are seasonal temperature or precipitation categories favored? | The weather on one particular day |
| Local forecast close to Christmas | What conditions are expected for this location over the forecast period? | A certainty that cannot change as new information arrives |
A sensible reading order is to start with history for context, read the seasonal outlook for the broader pattern, then switch to local forecasts when Christmas enters their time range. Do not combine percentages from different products as if they were parts of one calculation.
What NOAA’s 2026–2027 winter outlook says
NOAA published its U.S. Winter Outlook on October 15, 2026. It describes how El Niño is expected to influence December 2026 through February 2027, including favored warmer conditions across much of the northern U.S. and wetter conditions across parts of the South and East.
Those statements concern seasonal categories. “Wetter” does not mean that precipitation must fall as snow on December 25. “Warmer than average” does not mean every day will be warm or that no snow can occur.
The same NOAA release explicitly says its outlook does not project seasonal snowfall totals and that snow forecasts are generally not predictable more than a week ahead. It lists November 19 as the next outlook update. An updated seasonal outlook will still not be a Christmas-Day forecast.
How to use NOAA’s historical white-Christmas map
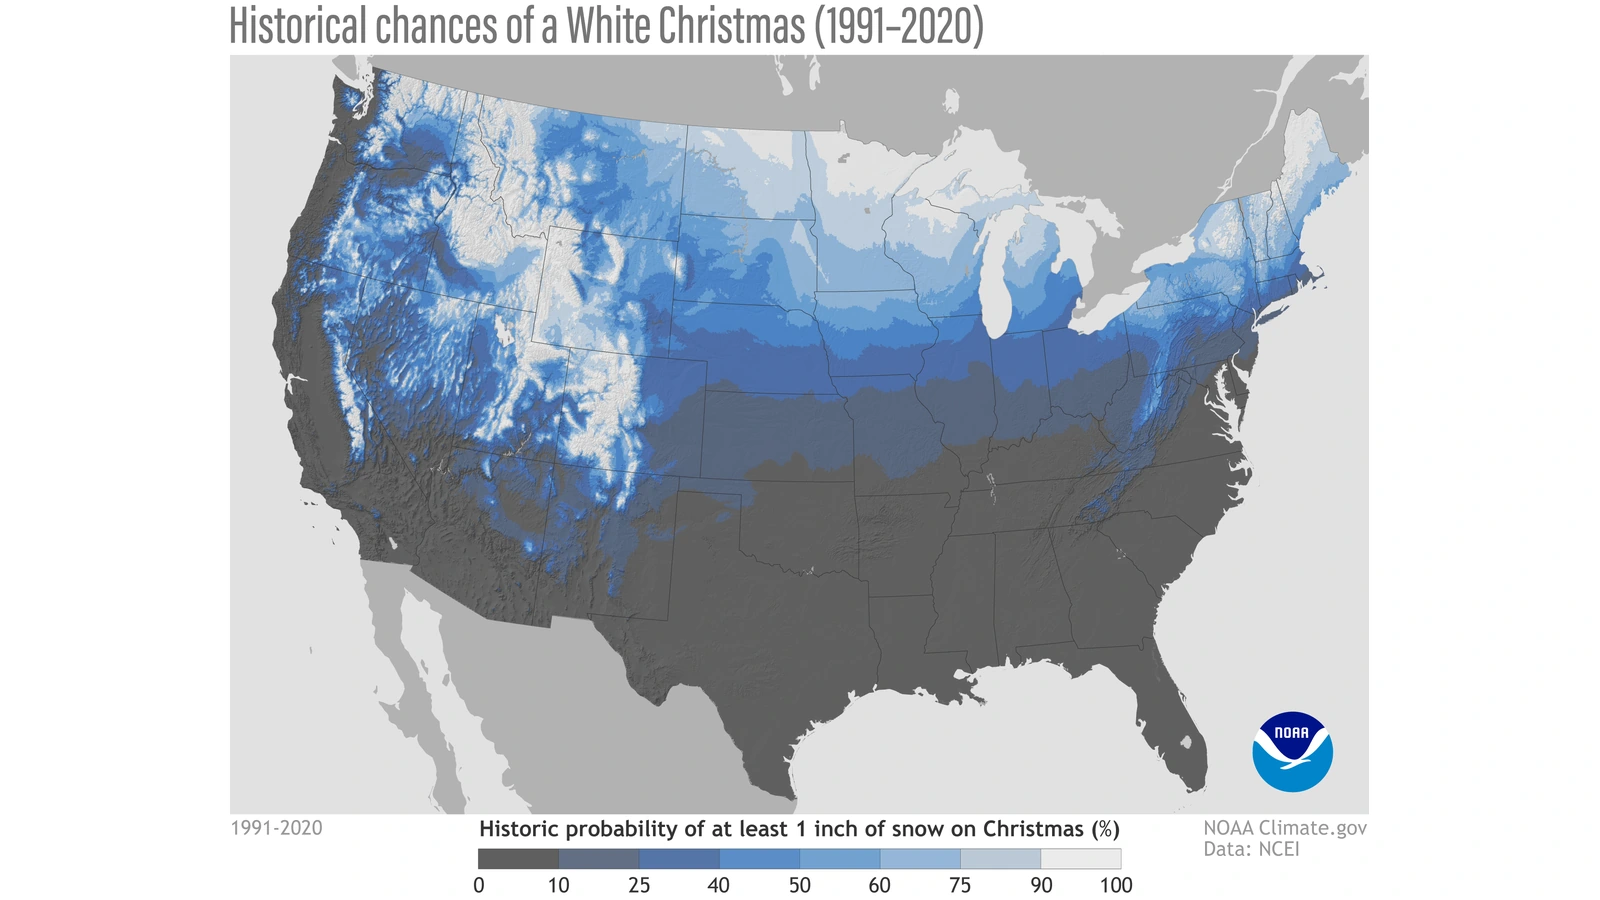
Start with NCEI’s white-Christmas guide, then follow its link to the interactive NOAA map. The reference period is 1991–2020. The static map above is an official historical graphic, not a screenshot of a 2026 forecast.
- Find your destination, not just its state. A large state can contain very different settings. Locate the town and inspect the nearby station information available in the map.
- Read the legend before interpreting a color. Confirm that the layer is about the December 25 snow-depth threshold, rather than snowfall amounts or seasonal precipitation.
- Check which station represents your location. Record the station name and any location details supplied. A nearby point is not automatically an exact match for your hotel or home.
- Write down the reference period. Label the result “historical probability, 1991–2020,” rather than “2026 snow forecast.”
- Keep the link for later comparison. Return to local forecasts in December instead of repeatedly treating the same historical map as new information.
These are a guide to interpreting the linked resources, not a claim that we queried every U.S. station. Map controls and data availability can change. If the interactive application does not load, the NCEI explanation and static graphic still describe the historical measure; a loading failure does not mean the chance of snow is zero.
Where history favors snow—and why a city percentage needs care
NCEI identifies places including Minnesota, Maine, Upstate New York, much of Idaho and the Rockies and Sierra Nevada as historically favorable areas. Its examples describe snow on the ground, not guaranteed snowfall during a holiday visit.
Avoid assigning one precise percentage to an entire state or loosely defined region. If you publish a city value, retain the station, threshold and reference period with it. A rounded national map is useful for context, but it cannot justify inventing a neighborhood-level figure.
For travel, ask a more practical question than “Which state is snowiest?” Compare the actual destination, the travel dates and your tolerance for changes. A historic snow advantage is not a guarantee of safe roads or an operating flight.
A worked probability example without invented city data
Suppose a hypothetical station met a snow-depth threshold in 18 of 30 reference years. Its simple observed frequency would be 18 ÷ 30 × 100 = 60%. These numbers are invented solely to explain the arithmetic; they are not a measurement for any named city and do not reproduce NOAA’s processing method.
A 60% historical frequency would not mean “60% of the city will be snowy.” It would not mean six inches of snow, six snowy days in ten, or a verified 60% forecast for December 25, 2026.
The denominator and event definition matter as much as the percentage. A number without those details is difficult to interpret responsibly. And a historical sample does not automatically represent every future climate condition or local setting.
When should you check the actual Christmas forecast?
NCEI recommends checking Weather.gov within seven days of Christmas for actual weather conditions. For December 25, that means beginning around December 18, then revisiting the forecast as the date approaches.
Use the official location search for the town or address you need. Check the forecast’s valid dates, not only the page’s publication or update time. A forecast issued today may describe next week rather than Christmas.
As useful detail becomes available, separate three decisions: whether snow is likely to be present, whether precipitation is expected while you travel, and whether official advisories affect the route. If the forecast range does not yet reach December 25, the honest answer is that the day is not covered—not that snow is ruled out.
How to compare conflicting Christmas predictions
Two pages can appear to disagree while describing different quantities. One may present a historical snow-depth map; another may give a publisher’s long-range outlook. Neither should be silently relabeled as an official local forecast.
Use this short comparison:
- Issuer: Is it NOAA, a local forecast office or another publisher? Name the source accurately.
- Target period: One day, a week or a three-month season?
- Variable: Snow depth, falling snow, temperature or total precipitation?
- Geography: A station, a city or a broad region?
- Evidence date: A historical reference period or a forecast issuance date?
If those five fields differ, resolve the mismatch before comparing the headline numbers. A dramatic headline with a city-by-city answer in early November deserves a check of its method and limits, rather than automatic acceptance or dismissal.
What you can decide now
Use historical patterns to compare destinations and decide what kind of holiday experience you want. Keep bookings flexible where possible if snow is the main reason for the trip. Do not treat a map color as insurance against disappointing weather.
Save the official local forecast link, and make a separate plan for changes in transport or access. For international arrangements, our U.S.–UK clock-change guide explains why a date and named time zone are clearer than an informal time offset.
The useful answer today is not a confident yes or no for every American city. It is knowing which information is available, what each map measures and when a local forecast can finally address December 25.
Sources, dates and image credits
Reviewed November 3, 2026. No city-level 2026 snow probabilities were calculated or claimed for this guide.
- NOAA: U.S. Winter Outlook, October 15, 2026.
- NOAA: historical chances of a white Christmas.
- NCEI: white-Christmas climatology and forecast timing.
- NOAA interactive historical map.
- National Weather Service local forecasts.
Featured photograph: a car in a Broomfield, Colorado, snowstorm in 2024, credited to Bob Hyatt/NOAA. It does not show Christmas 2026. Historical map: NOAA Climate.gov, based on 1991–2020 climate normals.
You may also like
 Science & Discoveries
UK November Cold Snap: What the Met Office Forecast Says
What the Met Office forecast says about the UK November cold snap, possible northern wintry showers, frost and…
 Science & Discoveries
Altermagnetism Explained: What the New Evidence Shows
What is altermagnetism? Understand the new MnTe experiment, how it differs from other magnetic orders, and what the…
 Science & Discoveries
Dinosaur Blood in a 115-Million-Year-Old Fossil? What the Evidence Shows
A Brazilian dinosaur fossil contains heme signatures and cell-like structures. See how researchers tested the evidence, why it…